


The meeting started like any other.
It was a Tuesday afternoon in Shanghai. A European beauty brand had just wrapped a seven-figure Q3 campaign across Xiaohongshu, Douyin, and Tmall Global. The agency was presenting results.
“13.2 million impressions. 215,000 engagements. A 8.3% engagement rate — well above industry average.”
The brand’s China director nodded approvingly.
Then the finance lead spoke up.
“How many of those engagements actually bought something?”
Silence.
The agency’s attribution report credited last-click conversions. The livestream that closed the sales looked like the hero. But the brand’s CRM team had been running a separate analysis — mapping customer journeys, not just tracking clicks.
Their finding stopped the meeting cold.
Eighty-seven percent of customers who made a purchase had first discovered the brand through a Xiaohongshu mid-tier creator two weeks before the Douyin livestream.
The livestream had taken the final credit for every one of those sales.
The mid-tier creators had gotten almost nothing — not in attribution, not in budget allocation for the next campaign.
One simple question had revealed a $400,000 budget misallocation across the brand’s influencer program. They had been undervaluing the creators who actually built consumer trust and overfunding the channels that merely closed the deal.
This is not an isolated story. It is the daily reality of influencer marketing in China in 2026.
The $16.8 Billion Question
China remains the world’s largest influencer market, forecast to reach RMB 117.2 billion (approximately USD 16.8 billion) in 2025, with influencer content now taking the largest share of marketing investment for consumer goods and beauty brands — second only to e-commerce spend.
In 2025 alone, official KOL prices increased by 11.6% year-on-year, though actual paid prices fell by 3.4%, pointing to growing confusion and lack of transparency in pricing. Marketing and finance teams are asking tougher questions: Does this spend build long-term brand value or just short-term attention? Where is the link between spend and profit?
The gap between the complexity of China’s consumer journey and the simplicity of most brands’ measurement models has become the single biggest source of wasted marketing spend.
Why Traditional Attribution Fails in China
Most brands enter China expecting a linear purchase path. Discovery → Research → Purchase. Attribution is straightforward. But, that is not how Chinese consumers behave.
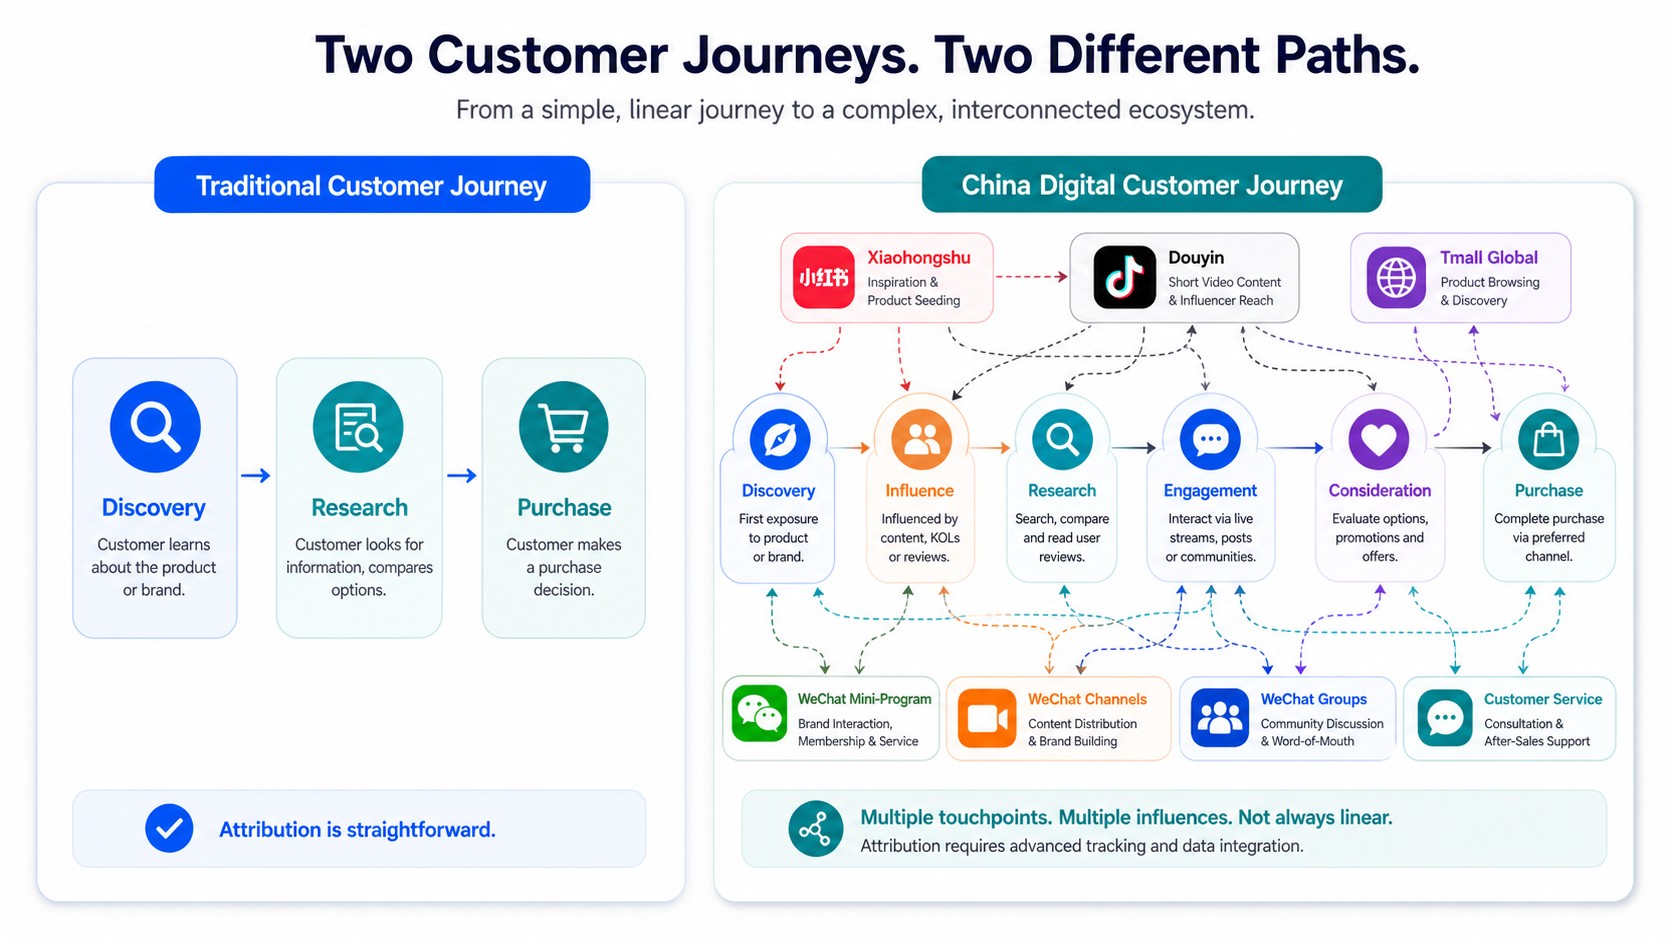
A typical customer journey for an imported skincare or supplement product now involves five to seven touchpoints across multiple platforms:
Day 1: Scrolling Xiaohongshu. A creator’s honest review of a Korean moisturizer catches her attention.
Day 3: She sees a Douyin short video comparing that product with two competitors. She saves it.
Day 7: The brand appears in a Douyin livestream. A host demonstrates application techniques. She watches for 20 minutes but doesn’t buy.
Day 10: She returns to Xiaohongshu to search the product name. Finds 15 more reviews. Reads the comments.
Day 12: She searches on Tmall Global. The product is still in her cart from last week.
Day 14: A promotional discount appears in her WeChat mini-program from the brand. She purchases.
The question becomes not which influencer deserves credit?, but how much credit should each touchpoint receive?
The Six Attribution Models — and When to Use Each
- First‑Touch Attribution: The Brand Builder
How it works: 100% of credit goes to the first interaction.
Best for: New market entry campaigns where the primary goal is awareness and understanding which channels drive initial discovery.
The trap: It ignores everything after the first click. A brilliant Xiaohongshu post that introduces the brand gets full credit — even if the consumer needed five more touchpoints to finally purchase.
Example use case: A supplement brand entering China for the first time runs ten creator campaigns simultaneously. First-touch attribution reveals that Korean skincare influencers drive the highest discovery rates — informing its platform strategy for the next quarter.
- Last‑Touch Attribution: The Transaction Tracker
How it works: 100% of credit goes to the final touchpoint before purchase.
Best for: Short-term conversion optimization where the goal is understanding which channels close sales.
The trap: It systematically undervalues top-of-funnel creators. The beauty brand in our opening story lost 87% of attribution credit for its Xiaohongshu creators under this model — and nearly cut their budget as a result.
Example use case: A brand running daily promotional livestreams uses last-touch attribution to compare host performance week over week.
- Linear (Multi‑Touch) Attribution: The Balanced View
How it works: Equal credit distributed across all touchpoints in the journey. A six-touch journey gives each interaction 16.7% credit.
Best for: Brands with stable customer journeys and enough data to identify typical touchpoint patterns.
The trap: “Equal” is rarely accurate. A Douyin livestream that drives 60% of purchase consideration deserves more credit than a static product page view, but linear attribution treats them identically.
Example use case: An established beauty brand with consistent customer journey patterns uses linear attribution as a baseline before moving to more sophisticated models.
- Time‑Decay Attribution: The Recency‑Sensitive Model
How it works: More recent touchpoints receive higher credit. Common weighting: last touchpoint gets ~40%, the one before ~25%, and so on.
Best for: Short purchase cycles (under 30 days) where recency strongly predicts conversion.
The trap: It undervalues early brand-building touchpoints that may have influenced the consumer weeks before purchase.
Example use case: A promotional campaign with a 72-hour flash sale — recent interactions matter more than discovery from two weeks ago.
- Position‑Based Attribution (U‑Shaped): The Hybrid
How it works: First and last touchpoints receive the highest weight (often 40% each), with remaining credit distributed evenly among middle touchpoints.
Best for: Brands that recognize the value of both discovery and closing — common in CBEC beauty and wellness categories.
The trap: It still forces fixed weights that may not reflect actual consumer behavior.
Example use case: A wellness brand launching a new collagen product where Xiaohongshu discovery and Douyin livestream closing are both critical.
- Data‑Driven (Algorithmic) Attribution: The Future
How it works: Machine learning models analyse historical conversion data to determine the actual contribution of each touchpoint type. No fixed weights — the data determines the weights.
Best for: Brands with sufficient volume (500+ conversions per month) to train reliable models across platforms.
The trap: Requires significant data infrastructure, cross-platform identity resolution, and ongoing model maintenance.
Example use case: The beauty brand from our opening story — after discovering the 87% attribution gap — implemented a data-driven model that now automatically weights Xiaohongshu discovery posts at 35% and Douyin closing streams at 45%, with the remaining 20% distributed across search and social touchpoints.
The Metrics That Actually Matter
Attribution models tell you where credit should go. But you still need to measure how much value was generated.
For Awareness Campaigns
| Metric | Why It Matters |
| Reach (unique viewers) | How many new potential customers were exposed |
| Brand search lift | An increase in branded searches on Tmall or JD indicates genuine interest generated |
| Share of voice vs. competitors | Compares your brand’s visibility against category competitors |
On Xiaohongshu, brands using KOL collaborations see conversion rates 2.3 times higher than traditional channels, with micro-influencers delivering up to 312% ROI within six months.
For Consideration Campaigns
| Metric | Why It Matters |
| Saves (收藏) | On Xiaohongshu, this signals high purchase intent and is weighted heavily by the algorithm |
| Comment depth and sentiment | Deeper discussions signal loyalty; sentiment analysis predicts retention |
| Share velocity | High share rates within the first hour indicate virality and organic amplification |
For Conversion Campaigns
| Metric | Why It Matters |
| Customer Acquisition Cost (CAC) | Total campaign spend ÷ number of new customers acquired |
| Return on Ad Spend (ROAS) | Revenue generated ÷ total influencer investment |
| Incremental lift | Revenue during campaign minus baseline revenue (historically measured) |
| Customer Lifetime Value (CLV) | Projected revenue from acquired customers over their engagement period |
A practical benchmark: For beauty KOLs on Douyin or RedNote, a healthy ROI could range between 2.5 to 3. Such results require planning, investments and meticulous execution across operational support teams – supply chain, marketing, ecommerce operations, and even last mile logistics.
The Implementation Roadmap
Here is how to move from theory to practice.
Month 1: Foundation
- Map your customer journey. Interview your China team. Pull CRM data. Identify the 3–5 most common platform sequences your customers follow before purchase.
- Set up tracking infrastructure. Implement UTM parameters for all influencer content. Use unique discount codes per creator. Install pixel tracking on your Tmall Global or Douyin storefront.
- Establish baseline metrics. Measure current traffic, sales, search volume, and engagement levels before any campaign launch. Without a baseline, you cannot measure lift.
Month 2: Experimentation
- Run test campaigns with three attribution models simultaneously. Apply first-touch, last-touch, and a simple position-based model to the same data. Compare the results.
- Calculate platform-specific ROI using the formula:
ROI = (Net Profit from Platform ÷ Total Platform Marketing Cost) × 100%
Ensure cost components include content creation, KOL/KOC collaboration fees, paid promotion, and agency or staff costs.
- Track engagement quality over quantity. Measure saves, shares, and comment depth — not just likes. On Xiaohongshu, saves indicate strong purchase intent.
Month 3: Optimization
- Shift budget toward top-performing touchpoint types. The beauty brand increased Xiaohongshu allocation by 40% after discovering its true contribution.
- Set conversion windows appropriately. A 7-day attribution window accurately captures approximately 40% of influencer-driven sales, reducing misattribution.
- Calculate customer lifetime value for campaign-acquired customers. Compare CLV of customers acquired through different influencer tiers to guide future investment.
What Data‑Driven Attribution Looks Like in Practice
A European beauty brand entering China had struggled with unpredictable influencer ROI. Campaign performance varied wildly, and finance teams questioned every marketing dollar.
The solution was not hiring bigger creators. It was building an attribution system.
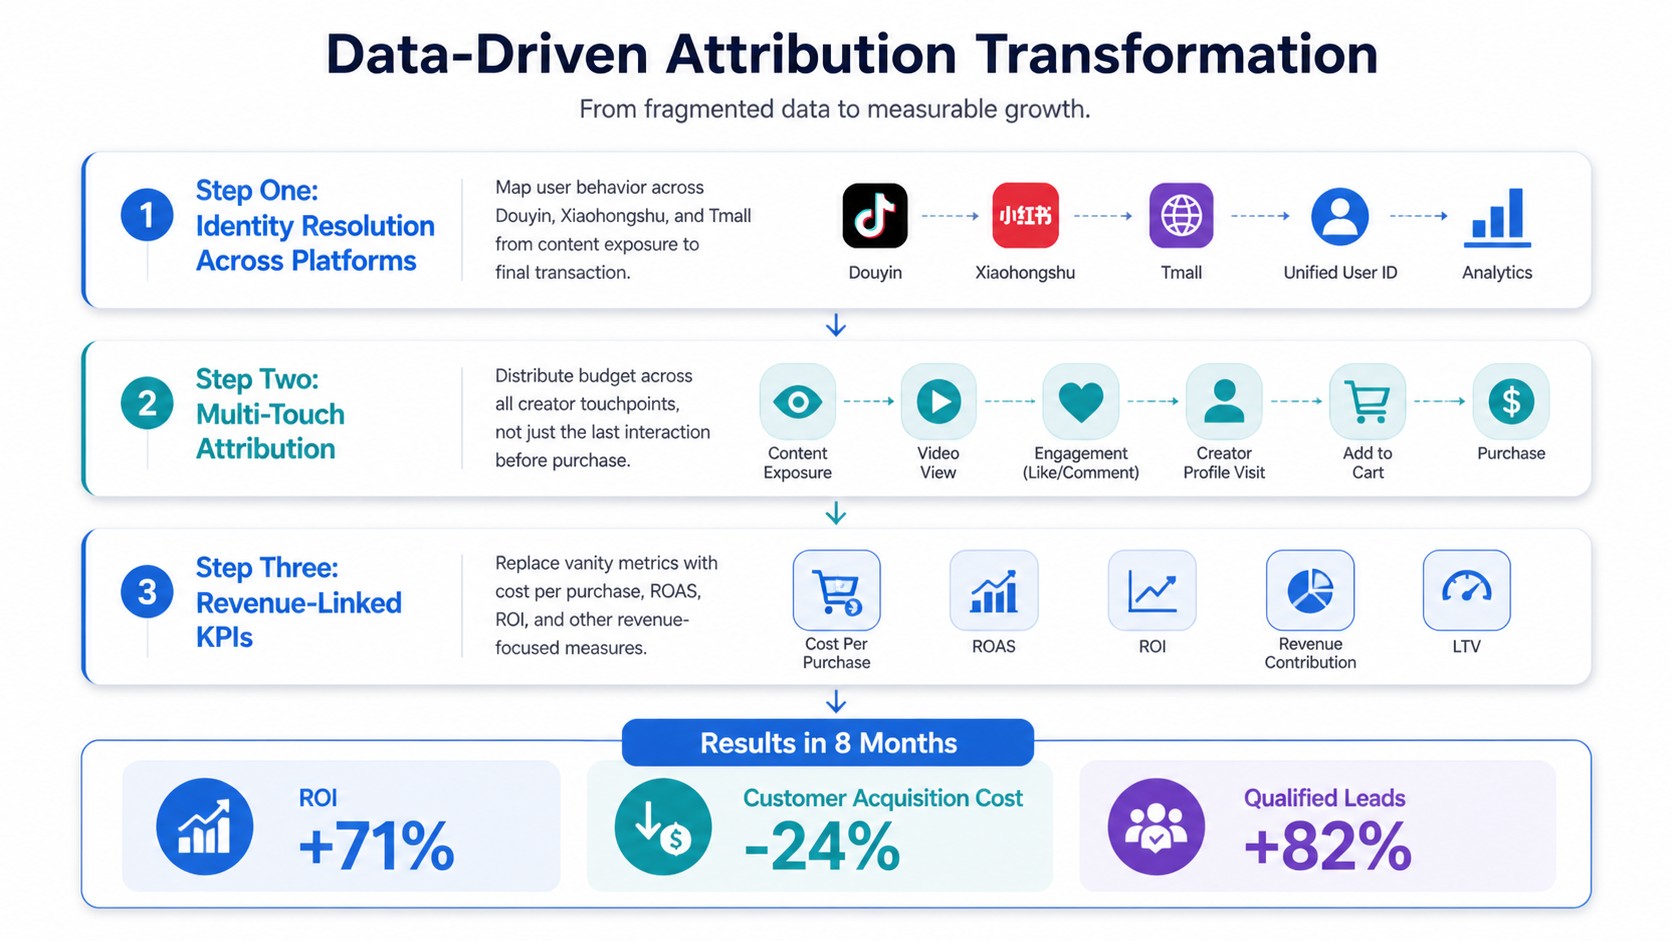
The result: Within eight months, the brand had shifted to a data-driven framework, improving ROI by 71% while reducing customer acquisition costs by 24% and increasing qualified lead generation by 82%.
The Cost of Doing Nothing
Influencer costs are rising. Consumer journeys are fragmenting. Finance teams are demanding clearer accountability.
Brands that continue relying on last‑click attribution will systematically underinvest in the creators who actually build consumer trust — and overinvest in the channels that merely capture demand that others have created.
Meanwhile, competitors with robust attribution frameworks are reallocating budget toward higher‑ROI creator partnerships, improving campaign efficiency quarter over quarter, and building defensible advantages in customer data.
The gap is widening.
Final Questions for Your Next Campaign
- If your reporting framework only credits last‑click conversions, which creators are you systematically undervaluing?
- Do you know the actual contribution of each platform — or are you applying fixed weights that bear no relation to your customers’ behaviour?
- When a finance lead asks “How many of those engagements actually bought something?” — can you answer with confidence?
In China’s complex digital ecosystem, the brands that win are not necessarily the ones spending the most on influencers. They are the ones that understand which touchpoints truly drive purchasing decisions and allocate budget accordingly.
Measurement is not a cost of doing business. It is a competitive advantage.
MyMyPanda helps international brands build attribution frameworks tailored to China’s multi‑platform ecosystem. From tracking performances across social media platforms and marketplaces to full‑funnel analytics, our integrated CBEC one-stop solution turns influencer spend into measurable growth.
Learn more or contact us for a free consultation
